There’s no doubt that romantic relationships are challenging and complex things that don’t always have a happy ending. And this is reflected in the divorce rate in Australia, which has fluctuated over the last 50 years.
This article will explore some statistics and factors contributing to divorce in Australia.
Key takeaways:
- the divorce rate in Australia initially increased after ‘no fault’ divorce was introduced in the 70’s but has now declined because fewer people are getting married
- the average marriage in Australia lasts 12 years with separation before divorce occurring around 8 years
- the majority of divorces occur due to communication issues, loss of connection, and infidelity issues

Marriage and divorce statistics in Australia
The average marriage length in Australia is currently 12 years, with separation before divorce occurring on average around 8 years.
When the Family Law Act introduced “no-fault divorce” in 1975, this significantly impacted marriages and divorce in Australia. This legislation was the first time the Australian divorce system made it possible to obtain a divorce regardless of the cause of the relationship breakdown.
As a result, the number of divorces in Australia increased dramatically, with the number of divorces granted in Australia reaching the highest recorded crude divorce rate the following year, at 4.5 per 1,000 people. That trend is now tipping in the opposite direction:
- Fewer people are choosing to get married.
- Those that do get married decide to cohabitate before deciding to marry.
- The average age for marriage has increased, with people waiting to get married until they have a better sense of what they want in a partner.
These factors have resulted in fewer marriages to get divorced from, and people better understand what it will be like to share a life with the other person before getting married.
Relationships require a lot of time and effort, and research shows that marriages end due primarily to inattention and a lack of taking care of the relationship:
- 27% of people reported communication problems
- 21% reported a loss of connection
- 20% reported trust issues or infidelity
Another significant change in marriage statistics is the decrease in religious ceremonies. Most people now choose a marriage ceremony officiated by a civil celebrant rather than a qualified religious sect member.
If you’re in Australia and considering relationship counselling services, click the button below to book a FREE 15-minute phone or Zoom inquiry call with me to find out how I can help.
Marriage and money
As of 2021, 60% of people are married, while only 8% are divorced. Those who are married are in better financial positions than those who aren’t, with divorcees more likely to identify as ‘spenders’.
One-quarter of Australians have reported lying to a partner about money, quoting hidden debt, a desire to maintain control over their finances, and hidden purchases as motives.
44% of Australians have reported control over their finances as a reason to be untruthful with a partner about finances. If you worry about this, being joint applicants on a shared financial account is one way to maintain economic openness and personal control over your finances.
Marriage, celebrations and age
Age-specific divorce rates tell us:
- The most common age to get married is 25-29 years old.
- The most common age to get divorced is 40-49 years old.
- The median age at divorce has a low rate of increase over time, changing from 41.4 in 2000 to 45.6 in 2020 for men and from 38.6 in 2000 to 42.8 in 2020 for women.
- The median age at marriage has a low rate of increase over time, changing from 31.4 in 2010 to 32.2 in 2020 for men and 29.2 in 2010 to 30.6 in 2020 for women.
- The duration of marriage between spouses of a younger age is statistically shorter than those who get married at an older age.
Wedding-specific statistics tell us how much Australian couples spend on average to get married:
- The average final cost of a wedding in 2018 was $31,368
- The average wedding budget is only $21,236
- The average cost of a wedding venue is $14,512
- The average honeymoon cost is $7,603
Marriage and divorce rates
According to the Australian Bureau of Statistics, the crude divorce rate in 2020 was 1.9 divorces per 1,000, staying the same as in 2019 – prior to the COVID-19 pandemic. In contrast, the crude marriage rate dropped from 4.5 in 2019 to 3.1 in 2020.
Marriage and divorce rates vary depending on factors such as previous marriages, age at marriage, location, and same-sex couples.
One of the indicators of your strength as a couple is your friendship and how well you know each other. Click the button below to take my quiz to find out how well you know your partner.
Multiple marriages
Only 30% of first-time marriages end in divorce. However, those who were married previously are statistically more likely to get married and divorced again. Up to 60% of second marriages end in divorce. Therefore, second and third marriages are significantly more likely to end in divorce than first marriages.
Divorce and age
The frequency of divorce rises in younger marriages compared to more mature marriages. The median length of a marriage ending in divorce is shorter when partners marry at a young age than when marriage occurs later in life.
Divorce by state
Australian divorces statistically vary from state to state. A couple’s living arrangements prior to marriage reportedly have a significant impact on the median duration and crude marriage rate of Australian marriages. The data table below shows that the number of marriages in Australia has steadily decreased since 2018 across all states.
| Australia | No. of Marriages | % Change from Previous Year |
|---|---|---|
| 2018 | 119,118 | |
| 2019 | 113,815 | -5% |
| 2020 | 78,989 | -31% |
New South Wales
| NSW | No. of Marriages | % Change from Previous Year |
|---|---|---|
| 2018 | 40,583 | |
| 2019 | 39,596 | -3% |
| 2020 | 27,609 | -30% |
Victoria
| Victoria | No. of Marriages | % Change from Previous Year |
|---|---|---|
| 2018 | 30,152 | |
| 2019 | 28,634 | -5% |
| 2020 | 16,627 | -42% |
Queensland
| Queensland | No. of Marriages | % Change from Previous Year |
|---|---|---|
| 2018 | 23,641 | |
| 2019 | 22,152 | -6% |
| 2020 | 15,917 | -28% |
South Australia
| South Australia | No. of Marriages | % Change from Previous Year |
|---|---|---|
| 2018 | 7,741 | |
| 2019 | 7,125 | -8% |
| 2020 | 5,432 | -24% |
Western Australia
| Western Australia | No. of Marriages | % Change from Previous Year |
|---|---|---|
| 2018 | 12,219 | |
| 2019 | 11,661 | -6% |
| 2020 | 9,561 | -18% |
Northern Territory
| Northern Territory | No. of Marriages | % Change from Previous Year |
|---|---|---|
| 2018 | 795 | |
| 2019 | 805 | +1% |
| 2020 | 552 | -31% |
Tasmania
| Tasmania | No. of Marriages | % Change from Previous Year |
|---|---|---|
| 2018 | 2,497 | |
| 2019 | 2,385 | -6% |
| 2020 | 2,013 | -16% |
Australian Capital Territory
| ACT | No. of Marriages | % Change from Previous Year |
|---|---|---|
| 2018 | 1,562 | |
| 2019 | 1,461 | -7% |
| 2020 | 1,275 | -13% |
Same-sex marriages
Same-sex marriage in Australia has been trending downward since 2018. The line chart below shows that the number of same-sex married couples decreased significantly between 2018 and 2020.
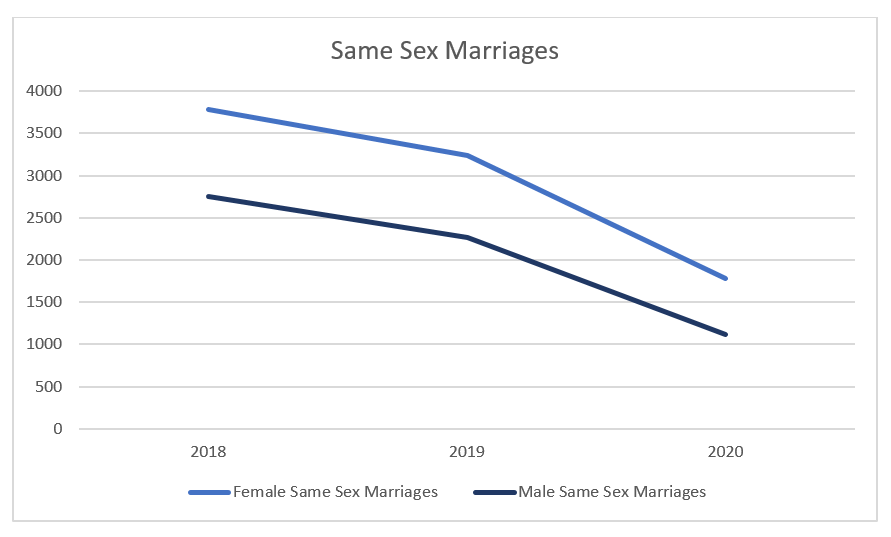
As shown in the chart, more female same-sex couples are getting married than male same-sex couples. However, both groups have seen a decrease in the number of married couples.
In both groups, over 97% of marriages were conducted by civil celebrants, which is even higher than in other married demographics.
Divorce and children
In 1975, 67% of divorces in Australia involved children. This number has decreased steadily over time, and in 2016, only 46% of divorces involved children.
As fewer people choose to get married, fewer people decide to get divorced, which results in a lower number of children being involved in divorce statistics.
Number of children involved in a divorce
In 2016:
- 39% of divorces involving children impacted one child
- 42% of divorces involving children impacted two children
- 14% of divorces involving children impacted three children
- 3% of divorces involving children impacted four children
- Less than 1% of divorces involving children impacted five or more children
Legal Support
If you are struggling to navigate a divorce involving children, a collaborative lawyer or professional mediation service can offer you support regarding the complexities of family court.
The takeaway
Long-term marriages are less common now than they were before 1975. The average length of a marriage before divorce often includes a period of separation before partners terminate their union. Navigating a divorce is more complicated when it involves managing a family at the same time.
As phases of a romantic relationship, marriage, and divorce are difficult to navigate.
If you’re struggling with either of these in your life or relationship, contact Clinton Power + Associates on (02) 8968 9323 during business hours to discuss your situation and find out how Clinton’s individual and couple counselling services can help, or book an appointment online now.
This article was updated in February 2023.
Since 2003, Clinton Power has helped thousands of couples and individuals as a counsellor and psychotherapist in private practice in Sydney and online in Australia. Clinton regularly comments in the media on issues of relationships and has appeared on Channel 7, The Sydney Morning Herald, and ABC Radio. Clinton’s eBook, 31 Days to Build a Better Relationship is available to download for free.